
What Is Total Harmonic Distortion (THD) in Op Amps?
Total Harmonic Distortion (THD) looks like a small number in a datasheet. Often tiny. Sometimes microscopic. Yet it carries enormous weight. It tells you how faithfully an operational amplifier (op amp) treats your signal—and how much it bends the truth.
In audio, THD shapes clarity and realism.
In sensors, it limits accuracy.
In precision systems, it decides whether your numbers can be trusted.
This article explains THD in op amps deeply but simply. Short sentences. Clear ideas. No fluff. By the end, you will read THD specs like a pro—and know when they matter and when they don’t.
Understanding Total Harmonic Distortion (THD)
THD measures unwanted frequency content added by an op amp when it amplifies a signal. The input is clean. The output is not.
An ideal op amp would amplify a sine wave and produce a perfect sine wave—just larger. Real op amps fail. Subtly or badly.
When a sine wave passes through nonlinear circuitry, it creates harmonics:
- 2nd harmonic at 2× the frequency
- 3rd harmonic at 3×
- 4th, 5th, and so on
These harmonics were not in the original signal. THD quantifies their total energy relative to the fundamental.
In plain terms:
THD tells you how distorted the output waveform really is.
“Distortion is simply nonlinearity made visible.” — Analog Devices Engineer’s Handbook
How THD Is Defined and Calculated
THD is calculated by comparing the RMS voltage of all harmonic components to the RMS voltage of the fundamental frequency.
[
\text{THD} = \frac{\sqrt{V_2^2 + V_3^2 + V_4^2 + \dots}}{V_1}
]
Where:
- (V_1) = fundamental frequency
- (V_2, V_3, \dots) = harmonic amplitudes
How THD Is Reported
- Percentage (%) – intuitive and common
- Decibels (dB) – preferred in precision and audio
Example:
- 0.01% THD ≈ −80 dB
- 0.0001% THD ≈ −120 dB
Lower is better. Always.
But context matters. A lot.
Visualizing Harmonic Distortion
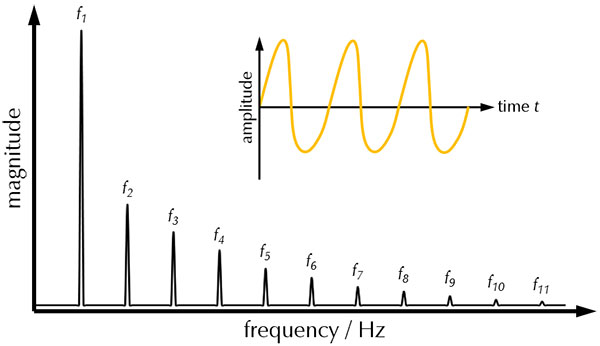
In the time domain, distortion looks like a warped sine wave. Flattened peaks. Asymmetry. Sharp edges.
In the frequency domain, distortion is obvious. A clean sine wave shows one spectral line. A distorted signal shows many—each harmonic standing like a warning sign.
Visualization matters because:
- Small THD numbers can hide audible distortion
- Harmonic order affects perception (2nd vs 7th harmonic)
- FFT plots reveal problems percentages cannot
Seeing distortion makes it real.
Sources of Harmonic Distortion Inside Op Amps
Distortion does not come from one place. It stacks up.
Major internal contributors:
- Input differential pair nonlinearity
Transistors are never perfectly linear. - Open-loop gain curvature
Gain changes with signal level. - Output stage crossover distortion
Especially in Class AB designs. - Thermal effects and bias variation
Temperature shifts behavior in real time.
Each stage adds its fingerprint. Negative feedback hides much of it—but never all.
Role of Negative Feedback in Reducing THD
Negative feedback is the hero of modern analog design.
It works by:
- Sensing output error
- Feeding it back to the input
- Forcing the op amp to correct itself
More loop gain means less distortion.
But here’s the catch:
Feedback only works while gain is available.
At high frequencies:
- Open-loop gain drops
- Loop gain collapses
- Distortion rises sharply
This is why op amps show low THD at 1 kHz and much worse THD at 20 kHz.
Feedback is powerful.
It is not magic.
THD Measurement Conditions (Why Specs Need Context)
A THD number without test conditions is meaningless.
Always ask:
- Frequency – 1 kHz? 10 kHz? 20 kHz?
- Amplitude – 100 mV or near the rails?
- Supply voltage – ±15 V or single 5 V?
- Load resistance – 100 kΩ or 600 Ω?
Change any one—and THD changes.
Common pitfalls:
- Datasheets quote typical, not guaranteed values
- Tests use ideal loads you may not have
- Rail-to-rail outputs distort badly near the rails
THD specs are context-dependent truths.
THD vs Frequency and Output Level


THD behaves predictably—and badly—under stress.
With increasing frequency:
- Loop gain decreases
- Slew rate limits appear
- Distortion rises exponentially
With increasing output amplitude:
- Output transistors leave linear region
- Headroom disappears
- Rail-to-rail designs suffer first
| Condition | THD Trend |
|---|---|
| Low frequency, small signal | Very low |
| High frequency | Much higher |
| Near output rails | Explodes |
| Heavy load | Increases |
Design margin is everything.
Why THD Matters in Real Applications
Not all applications need ultra-low THD.
Where THD is critical:
- Audio signal chains
- Precision instrumentation
- High-resolution data acquisition
- Medical and scientific sensors
Where THD is often overkill:
- Power regulation
- Logic-level buffering
- Slow control loops
| Application | Typical THD Requirement |
|---|---|
| Consumer audio | <0.01% |
| Pro audio | <0.001% |
| Precision measurement | <0.0005% |
| General-purpose | <0.1% |
Chasing vanishingly small THD can waste power, money, and time.
How to Use THD When Selecting an Op Amp
THD is not a standalone metric. It lives in a trade space.
Balance THD against:
- Noise
- Bandwidth
- Power consumption
- Supply voltage
- Cost
Practical checklist:
- Match THD frequency to your signal
- Match THD amplitude to real output swing
- Check THD vs frequency curves, not just one number
- Consider THD+N if noise matters
The best op amp is not the lowest-THD op amp.
It is the right op amp.
Key Takeaways on THD in Op Amps
- THD measures harmonic distortion caused by nonlinearity
- Lower THD means higher signal fidelity—but only in context
- Frequency, amplitude, load, and supply voltage matter
- Negative feedback reduces THD, but only within bandwidth
- Datasheet numbers are guides, not guarantees
THD is a lens.
Not the whole picture.
Learn to read it well—and your designs will sound better, measure cleaner, and behave exactly as intended.
