
Power Supply Rejection Ratio (PSRR) Explained: Why It Matters for IC Design and Purchasing


Power Supply Rejection Ratio—PSRR—sounds abstract. It is not.
It is one of the clearest predictors of whether a circuit will behave calmly or chaotically when power is imperfect.
And power is always imperfect.
Executives feel PSRR as customer complaints.
Engineers fight it in the lab.
Buyers see it as cost, risk, and supplier credibility.
As the old engineering proverb goes:
“A clean signal starts with a dirty supply handled well.”
This article explains PSRR in depth—but in clear language—so design teams and purchasing teams can make better, cheaper, safer decisions.
What Is Power Supply Rejection Ratio (PSRR)?
PSRR describes how well an IC blocks power supply noise from reaching its output.
In simple terms:
- A high PSRR IC ignores supply noise
- A low PSRR IC passes that noise straight into your signal
Definition in Simple Terms
PSRR is the ratio between:
- unwanted voltage changes on the power supply
- and the resulting voltage error at the output
The higher the ratio, the better the rejection.
How PSRR Is Expressed (dB)
PSRR is measured in decibels (dB):
| PSRR (dB) | Noise Rejection Meaning |
|---|---|
| 20 dB | Weak rejection |
| 40 dB | Moderate rejection |
| 60 dB | Strong rejection |
| 80–100 dB | Excellent (low-frequency only) |
Every 20 dB means 10× better rejection.
What PSRR Reveals
PSRR tells you:
- How clean your output really is
- How sensitive the IC is to regulator ripple
- Whether PCB fixes will save you—or not
Why PSRR Matters Across the Organization
PSRR is not just an engineering number. It is a business risk indicator.
Executives & Founders
Poor PSRR causes:
- Field failures
- Audio hiss
- Display flicker
- Sensor drift
These become returns, brand damage, and lost trust.
Engineers & R&D
Low PSRR means:
- Hard-to-debug noise
- Late-stage redesigns
- Endless “why does this only fail on Friday?” moments
Product Managers
PSRR affects:
- Spec compliance
- Feature trade-offs
- Whether performance degrades in real use
Procurement
PSRR drives:
- Hidden BOM cost (filters, ferrites, LDOs)
- Supplier risk
- Over-optimistic datasheets
How PSRR Is Defined: The Technical Perspective
The PSRR Formula
PSRR is defined as:
[
PSRR = 20 \log \left(\frac{\Delta V_{supply}}{\Delta V_{output}}\right)
]
This means:
- Small output change = good
- Large output change = bad
High vs. Low PSRR
- High PSRR → robust against noise
- Low PSRR → output tracks supply fluctuations
Typical vs. Minimum Specs
Datasheets love typical PSRR.
Designs fail at minimum PSRR.
| Spec Type | Risk Level |
|---|---|
| Typical | Marketing-friendly |
| Minimum | Design-relevant |
| Over temperature | Reality |
PSRR vs. Related Power Integrity Metrics
PSRR is often confused with other specs. They are not the same.
| Metric | What It Measures |
|---|---|
| PSRR | Supply noise → output |
| CMRR | Common-mode signal rejection |
| Line Regulation | DC supply changes |
| Ripple Rejection | AC ripple at fixed freq |
Common Misconception
High line regulation ≠ high PSRR
They operate in different frequency domains.
PSRR vs. Frequency: Why a Single Number Is Misleading
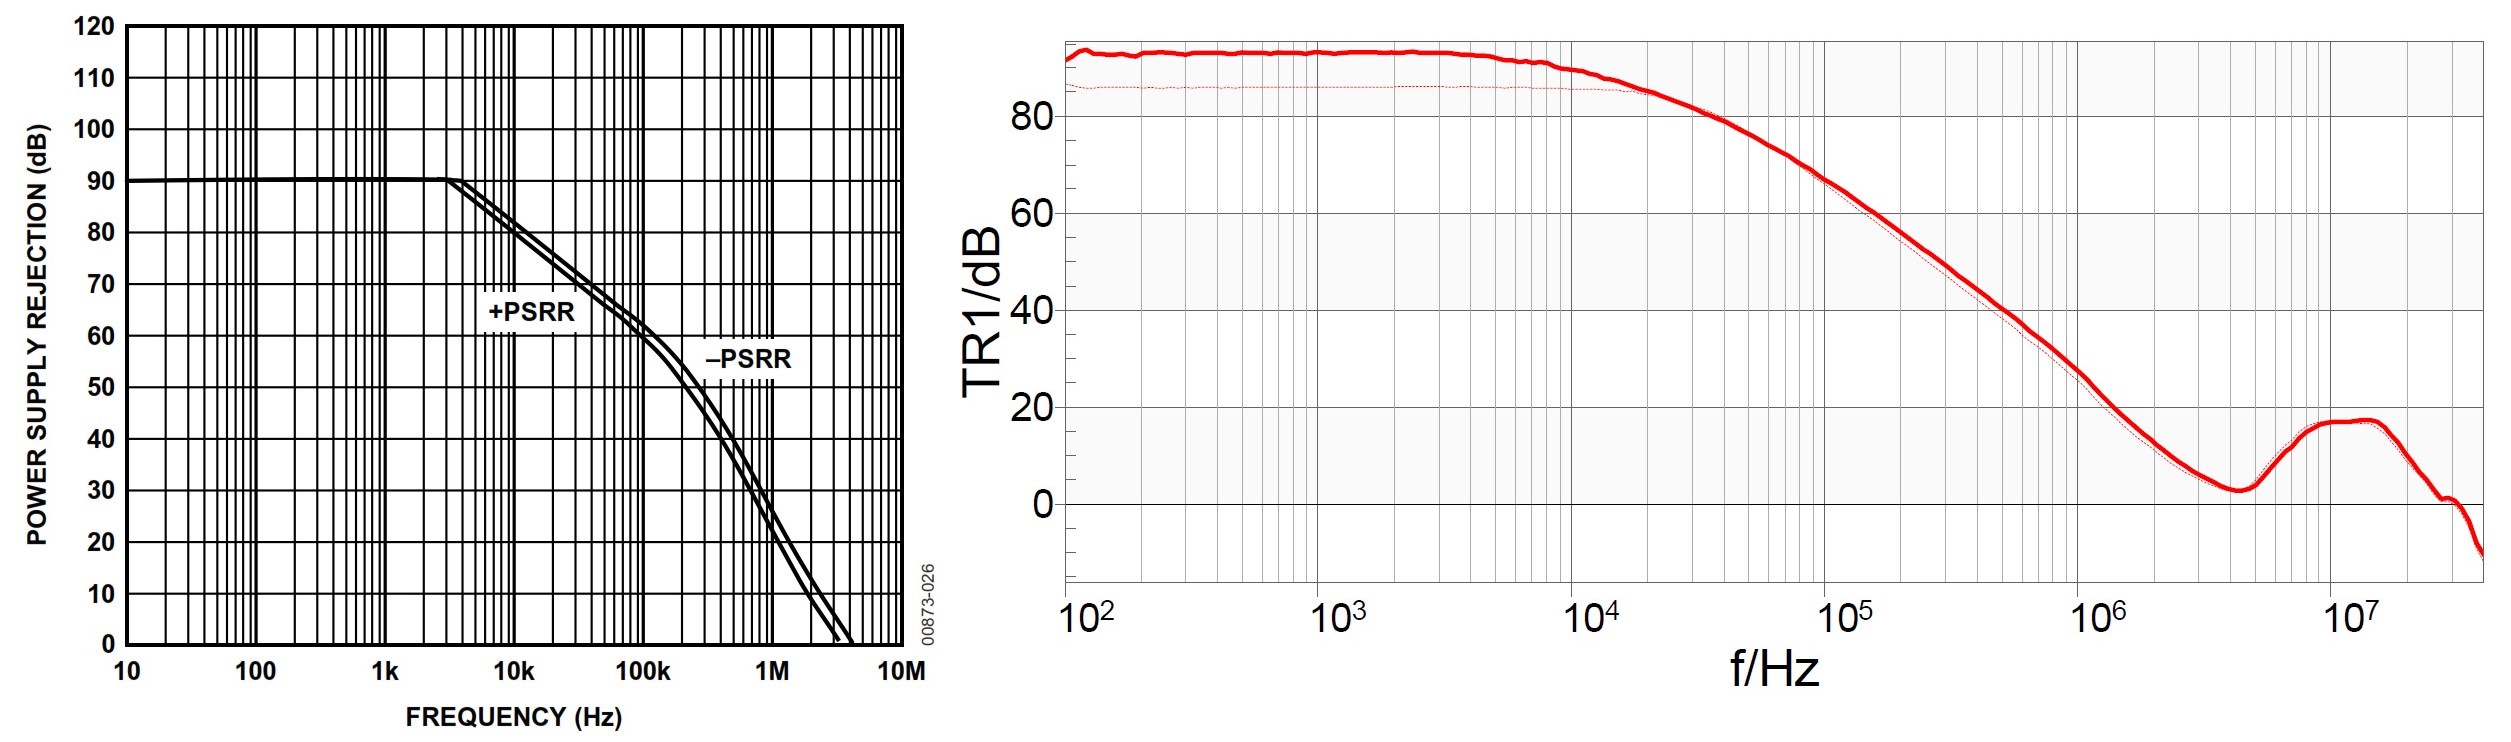
PSRR Is Frequency-Dependent
PSRR is strong at low frequencies.
It collapses at high frequencies.
A device with:
- 90 dB at 10 Hz
- may have only 20 dB at 1 MHz
Why PSRR Degrades
- Parasitic capacitances
- Finite gain bandwidth
- Internal transistor coupling
Why Curves Matter
The curve tells the truth.
The headline number sells the part.
Load, Temperature, and Process Effects on PSRR
Load Dependence
PSRR changes with current:
| Load Condition | PSRR Behavior |
|---|---|
| No-load | Looks great |
| Light-load | Often worst |
| Heavy-load | Internal gain drops |
Temperature Effects
As temperature rises:
- Gain falls
- Bias shifts
- PSRR drops
Process Corners
Worst-case silicon can lose 20–30 dB of PSRR.
This is why:
“Typical specs build demos. Worst-case specs ship products.”
PSRR in Common Integrated Circuits


Operational Amplifiers
Poor PSRR causes:
- Offset drift
- Gain error
- Noise floor rise
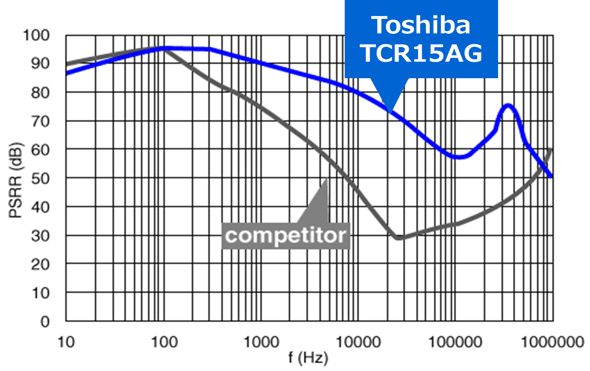
LDO Regulators
PSRR determines:
- How much switching noise leaks through
- Whether downstream analog survives
ADCs and DACs
Supply noise directly reduces:
- SNR
- ENOB
- Measurement accuracy
Mixed-Signal SoCs
Shared supplies = shared pain.
Digital noise always wins without isolation.
PCB Layout and Measurement Reality
Layout Can Destroy PSRR
Even the best IC fails with:
- Long supply traces
- Shared return paths
- Missing high-frequency caps
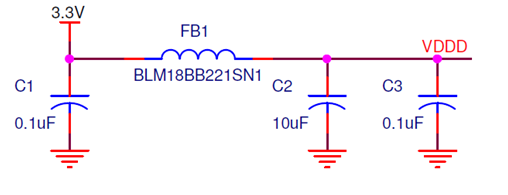
Decoupling Matters
Good PSRR assumes:
- Tight loop areas
- Multiple capacitor values
- Low inductance paths
Why Lab PSRR Looks Worse
Datasheets assume:
- Ideal supplies
- Perfect grounding
- Zero EMI
Real boards never do.
How to Improve PSRR in Design and Purchasing
Design Techniques
- Use local LDOs near sensitive blocks
- Split analog and digital supplies
- Short, wide power traces
- Proper capacitor placement
How Buyers Should Evaluate PSRR
Ask suppliers:
- Is this typical or guaranteed?
- At what frequency?
- At what load and temperature?
- Where is the curve?
System-Level Trade-Off
Higher PSRR ICs often:
- Reduce filters
- Simplify layout
- Cut debug time
Higher IC cost can mean lower system cost.
Key Takeaways
- PSRR measures how well ICs reject dirty power
- A single PSRR number is misleading
- Frequency, load, temperature, and layout matter
- Typical specs are optimistic; minimum specs are real
- Good PSRR reduces cost, risk, and redesigns
In the end, PSRR is not just an electrical parameter.
It is a confidence metric.
Designs with strong PSRR survive reality.
Designs without it survive only simulations.
