
IC Reliability Metrics Explained: MTBF, MTTF, FIT, and Failure Rate
Integrated circuits (ICs) are the silent engines of modern products. From consumer gadgets to life-critical automotive systems, they are expected to work—every time, without excuse. Reliability metrics exist for one reason: to turn uncertainty into quantified risk. But MTBF, MTTF, FIT, and failure rate are often misunderstood, misused, or oversold.
This article cuts through the noise. You’ll learn what each metric really means, when it applies, and how to use it correctly in engineering and business decisions—without false confidence.
Why IC Reliability Metrics Matter in Product and Business Decisions
Reliability metrics sit at the crossroads of engineering and strategy. They influence design choices, supplier selection, warranty exposure, and brand trust.
A famous reminder from W. Edwards Deming captures the risk well:
“In God we trust. All others must bring data.”
Reliability data is that trust mechanism.
Business impact
- Warranty cost: Small changes in FIT can mean millions in long-term returns.
- Brand reputation: Failures in the field are remembered longer than launch features.
- System uptime: Especially critical in industrial, telecom, and automotive markets.
Who relies on these metrics
- Executives & product managers – pricing, warranty, roadmap risk
- Design & reliability engineers – margins, derating, architecture
- QA, manufacturing & supply chain – qualification, sourcing, EOL planning
Reliability metrics don’t promise perfection. They frame risk in numbers so decisions are intentional, not accidental.
Core IC Reliability Metrics Overview
At the IC level, almost every reliability metric traces back to failure rate (λ).
Failure Rate (λ): the foundation
Failure rate is the expected number of failures per unit time, usually expressed as failures per hour.
Key assumption:
- During the useful life period, ICs are often modeled with a constant failure rate.
This simplifies analysis. It also introduces risk if used blindly.
FIT (Failures In Time): the industry standard
FIT = failures per 10⁹ device-hours
Why suppliers prefer FIT:
- Scales cleanly for large volumes
- Aligns with accelerated test data
- Avoids the psychological trap of “years” implied by MTBF
Typical ranges (very approximate):
| Application | Typical FIT Range |
|---|---|
| Consumer electronics | 100–1000 FIT |
| Industrial | 10–100 FIT |
| Automotive | 1–10 FIT |
Metric relationships (when valid)
| Metric | Relationship |
|---|---|
| MTBF | 1 / λ |
| MTTF | 1 / λ (non-repairable) |
| FIT | 10⁹ / MTBF |
⚠️ These conversions only hold under a constant failure rate assumption.
Understanding MTTF (Mean Time To Failure)
MTTF applies to non-repairable devices, which includes most ICs.
It represents the statistical average time to failure across a population—not a promise for any single part.
What MTTF really tells you
- A design-level indicator of expected robustness
- A way to compare relative reliability, not predict lifespan
What it does not tell you
- When the first failure will occur
- How long a specific unit will last
Think of MTTF like life expectancy. It informs planning. It does not guarantee survival.
Understanding MTBF (Mean Time Between Failures)
MTBF is often quoted—and often wrong.
Correct definition
MTBF applies to repairable systems, where failure is followed by repair and return to service.
Why MTBF is misused for ICs
- ICs are usually not repaired, only replaced
- Quoting MTBF for a single IC creates false confidence
- High MTBF values (“10 million hours!”) sound impressive but mislead buyers
MTBF does not predict:
- Time to first failure
- Field return timing
- Product lifetime
Used incorrectly, MTBF becomes a marketing number—not an engineering one.
MTBF vs MTTF vs FIT: Key Differences and Proper Usage
| Metric | Measures | Best Used By | Common Misuse |
|---|---|---|---|
| Failure rate (λ) | Failure intensity | Reliability engineers | Ignored uncertainty |
| FIT | Failure frequency | IC buyers & suppliers | Compared across standards |
| MTTF | Average life | Design engineers | Treated as guarantee |
| MTBF | Repair interval | System engineers | Applied to ICs |
Buyer guidance:
If you’re sourcing ICs, ask for FIT at mission conditions, plus:
- Test method
- Confidence level
- Assumed temperature and voltage
Statistical Assumptions and Their Limits
Most MTBF and MTTF values rely on the exponential distribution, which assumes:
- Constant failure rate
- Random, independent failures
Reality is messier.
Why this matters
- Early-life defects violate the model
- Wear-out mechanisms break the constant-λ assumption
- Small sample sizes inflate optimism
Without confidence intervals, MTBF numbers are directional at best.
The Bathtub Curve in IC Reliability

The bathtub curve explains why simple metrics fail outside their comfort zone.
Three regions
- Early life (infant mortality)
Process defects, contamination, weak die - Useful life (random failures)
Where FIT, MTBF, and MTTF apply - Wear-out
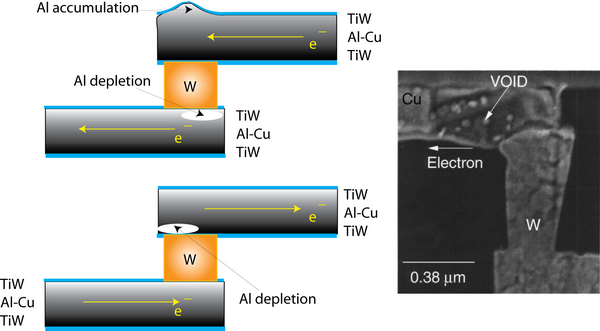
Physics takes over:- Electromigration
- TDDB
- NBTI / HCI
Reliability metrics only describe the flat middle, not the whole story.
Weibull Distribution and Advanced Reliability Modeling

When accuracy matters, engineers move beyond MTBF.
Weibull shape factor (β)
- β < 1 → early failures
- β ≈ 1 → random failures
- β > 1 → wear-out dominated
Why Weibull wins:
- Separates failure modes
- Fits real field data
- Supports lifetime projection
Use Weibull when:
- You care about end-of-life risk
- Safety or automotive standards apply
- Field return data is available
How IC Manufacturers Derive Reliability Metrics

Reliability numbers don’t come from thin air.
Accelerated testing
- HTOL
- HAST
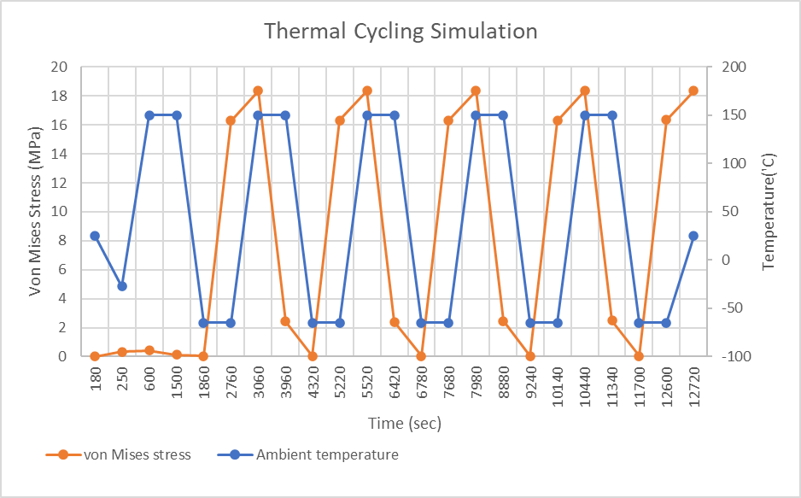
- Temperature cycling
- Voltage overstress
Failures are accelerated, then extrapolated using physics-based models.
Stress factors
- Junction temperature
- Voltage and current
- Environment
Important distinction:
- Demonstrated reliability: what was tested
- Predicted reliability: what models estimate
Never confuse the two.
Key Takeaways: How to Use IC Reliability Metrics Correctly
- FIT and failure rate are the most meaningful IC-level metrics
- MTTF and MTBF are statistical averages—not guarantees
- Metrics are only valid under their assumptions and conditions
- Mission profile, temperature, and confidence level matter more than the headline number
- Reliability metrics are decision tools, not promises
Used wisely, they reduce risk. Used blindly, they create it.
Reliability is not about believing numbers.
It’s about understanding what they hide.
