


How to Interpret Electrical Specifications Tables
Electrical specifications tables look dense. Rows. Columns. Footnotes. Tiny numbers with big consequences.
Yet these tables decide whether your design runs for ten years—or fails in ten seconds.
As the old engineering saying goes, “The datasheet always wins.”
This guide shows you how to read electrical specifications tables correctly, avoid common traps, and design with confidence—at a 7th-grade reading level, but with expert depth.
Below are the 8 most important sections you must master.
Understanding the Role of Electrical Specifications Tables
Electrical specifications tables are the contract between the manufacturer and the engineer.
They define:
- What a component will do
- Under which conditions
- And where it will fail
Engineers use them to design safely.
Technicians use them to test and troubleshoot.
Buyers use them to compare parts.
You will usually find these tables in:
- Component datasheets
- Reference manuals
- Manufacturer application notes
Authoritative standards bodies like IEC and JEDEC influence how these tables are written, ensuring consistency across vendors.
Key truth:
If it is not in the table, it is not guaranteed.
Structure of Electrical Specifications Tables
Most electrical specifications tables follow a predictable layout:
| Column | Meaning |
|---|---|
| Parameter | What is being measured |
| Symbol | Short technical name |
| Min | Lowest guaranteed value |
| Typ | Expected average value |
| Max | Highest guaranteed value |
| Unit | Volts, Amps, Ohms, etc. |
| Conditions | Test setup details |
You will often see two major table types:

Electrical Characteristics
These describe normal operation.
They are valid only under stated test conditions.
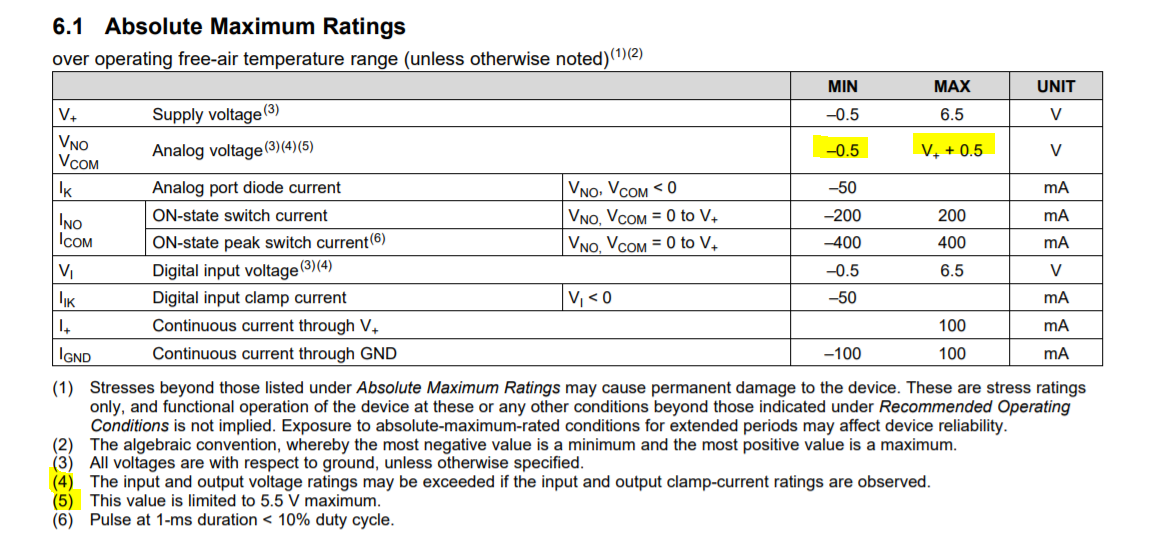
Absolute Maximum Ratings
These define survival limits, not working limits.
Why does the same parameter appear twice?
Because operating and surviving are very different things.
Test Conditions and Measurement Context
Numbers without context are meaningless.
Every electrical value depends on:
- Voltage
- Current
- Temperature
- Frequency
- Load
That is why you see lines like:
“Unless otherwise noted, TA = 25°C, VDD = 5V”
This single sentence controls every value in the table.
Different standards define how tests are done.
For example, MIL-STD methods often push components harder than commercial tests.
Golden rule:
If your real-world conditions differ from test conditions, expect different results.
Interpreting Core Electrical Parameters
This is where most mistakes happen.
Voltage
- Rated voltage is not the same as applied voltage
- Exceeding it—even briefly—can cause silent damage
Current
- More current means more heat
- Heat shortens component life
Resistance, Capacitance, Inductance
- These values change with temperature and frequency
- “Nominal” does not mean “constant”
Power
Power ratings assume:
- Ideal cooling
- Specific temperatures
- Proper mounting
AC vs DC
AC values include frequency effects.
DC values do not.
Mixing them up leads to instant failure.
Absolute Maximum Ratings vs Recommended Conditions
This section protects you from catastrophic errors.
| Term | What It Really Means |
|---|---|
| Absolute Maximum | Do not exceed—even once |
| Recommended | Safe for continuous operation |
| Guaranteed | Manufacturer-backed limits |
Operating near absolute maximum ratings is risky.
Tiny voltage spikes. Minor heat rises. Manufacturing variation.
Any of these can push the part over the edge.
Design proverb:
“Leave margin, or margin will leave you.”
Min / Typ / Max Values Explained
These three columns are not equal.
Minimum (Min)
The worst-case low value you can rely on.
Typical (Typ)
A statistical average.
Not guaranteed.
Not tested on every part.
Maximum (Max)
The worst-case high value.
| Design Rule | Reason |
|---|---|
| Use Min/Max | Guaranteed performance |
| Avoid Typ only | Process variation exists |
| Add margin | Aging and drift occur |
“Typical” values come from sampling, not promises.
Temperature, Tolerance, and Environmental Effects
Temperature changes everything.
Temperature Effects
- Resistance increases
- Leakage currents rise
- Timing shifts
Tolerance
A ±5% resistor is not “close enough” in precision circuits.
Long-Term Stability
Over time, components drift due to:
- Aging
- Thermal cycling
- Electrical stress
Designers apply derating to reduce stress.


Derating is not pessimism.
It is professionalism.
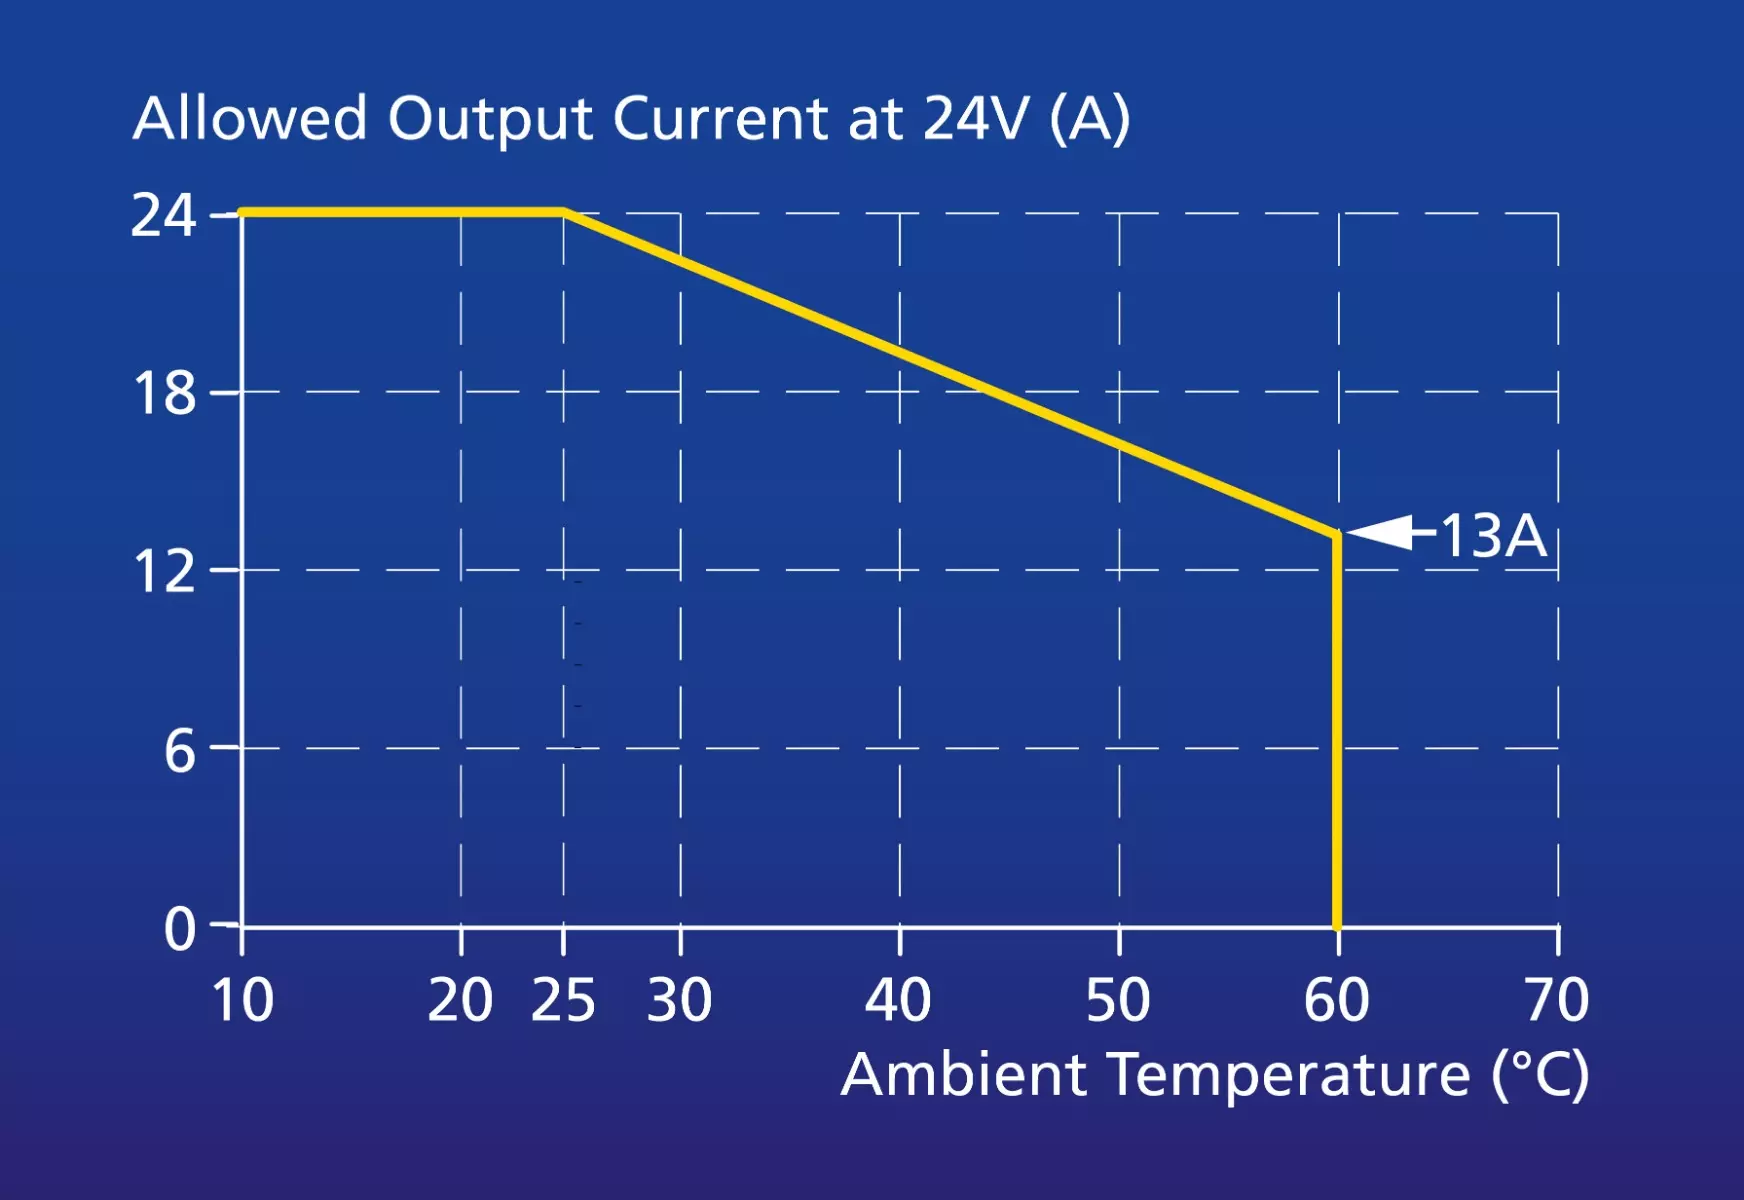
Reading Footnotes, Graphs, and Hidden Constraints
The most dangerous specs are not in the main table.
They hide in:
- Footnotes
- Asterisks
- Graphs
- Cross-references
Derating Curves
Tables show single points.
Graphs show reality.
Footnotes
One footnote can invalidate an entire row.
Conditional Specs
Some values apply only:
- At certain temperatures
- With specific packages
- Under limited duty cycles
If you skip footnotes, you skip the truth.
Common Mistakes and Best Practices
Frequent Errors
- Trusting typical values
- Ignoring temperature
- Mixing AC and DC specs
- Designing too close to limits
Best Practices
- Read tables line by line
- Match your conditions to test conditions
- Design using worst-case values
- Apply derating consistently
- Compare parts using identical criteria
Final Thoughts
Electrical specifications tables are not paperwork.
They are engineering reality.
Read them carefully.
Respect their limits.
Design with margin.
Or, as experienced engineers like to say:
“The schematic shows intent.
The datasheet shows the truth.”
Master these tables—and your designs will last.
